Experiments using the VISIR and alternating voltage
[PDF]
The VISIR is equipped with a function generator to produce alternating signals and an oscilloscope to detect them. The following figure shows the connection these devices in VISIR interface:

Now we should click on Function generator and select the type of signal, voltage and frequency. In our case, we are going to choose a sinusoidal signal of 10 Vpp and 1 KHz frequency, in both cases by turning the dial. When clicking on the oscilloscope, all we have to do is to click on button "1" and on Perform experiment (not on RUN or on SINGLE).

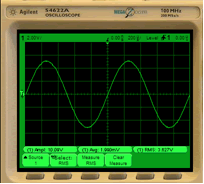
Once we have done this, the oscilloscope shows us the signal (see images below). In order to "read" the provided information we should adjust the time base (see black circle) and click again on Perform experiment. Now we can see that the vertical scale (see black circle) need to be adjusted and once again click on Perform experiment.

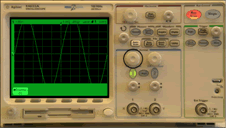
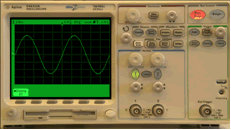
To measure the characteristic values of the signal (mean, effective, peak-to-peak, etc.), we need to activate the option Quick measurement. Then by clicking on the "Quick Meas" (see the black circle) you can use the scroll-down menu (see the first black circle in the second figure) and choose the measurement that you want to obtain clicking on Measure experiment (see the second black circle in the second figure) and finally on Perform experiment.So, we detect 10,17 V, instead of expected 10 V.


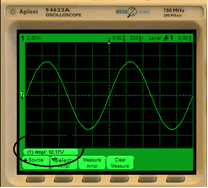
To measure the mean (average) and effective (RMS: root-mean-square) value we should repeat the previous steps. In this case the peak-to-peak value is 10.09 V, the mean value is 1.990 mV (i.e. nearly 0 V, the ideal or calculated value) and the effective value measured is 3.627 V, which is similar to 5/1.4142 = 3.5353 V.

|
 |

|
|
Now it makes sense to work with different signals in order to study which value is the most representative: the highest value (Vmax), the lowest value (Vmin), the distance between the highest and the lowest value (Vpp, Vpeak-to-peak), the mean value (Vcc, average), and the effective value (Vrms)? What is the effective value? Can you relate it to the statistical indicators?
Complete the following table for sinusoidal, triangular and square signals of 1KHz with different peak-to-peak value. Obtain a Vmax, Vcc, Vpp and Vef (Vrms) for each of them. Which one do you think is the most representative? Why?
|
Signal to be measured |
Oscilloscope |
Measurements |
|
Sinusoidal
f = 1 KHz Vpp = 10 V |
|
Vpp = 10,29 V Vmax = 5,513 V Vcc = 0,0049 V Vrms = 3,631 V |
|
Sinusoidal
f = 1 KHz Vpp = 6 V |
|
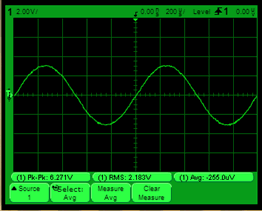
Vpp = 6,271 V Vmax = 3,173 V Vcc = -0,00026 V Vrms = 2,183 V |
|
Triangular
f = 1 KHz Vpp = 10 V |
|
Vpp = 10,16 V Vmax = 5,153 V Vcc = 0,00014 V Vrms = 2,973 V |
|
Triangular f = 1 KHz Vpp = 6 V |
|
|
|
Square
f = 1 KHz Vpp = 10 V |
|
|
|
Square
f = 1 KHz Vpp = 6 V |
|
|
Additional assignment: can you obtain a model to calculate the effective voltage of a signal depending on whether it is sinusoidal, triangular or square? For instance, the effective value in a sinusoidal signal is the maximum value divided by the square root of 2, Vef = Vrms = Vmax/1.4142.Is this the same for the other types of signal?

