Activity 3
The following data are collected in tables to deal with various data between different groups in which will have been divided the students-researchers, so that, afterwards in a common presentation, all works can establish their findings in the most reliable manner.
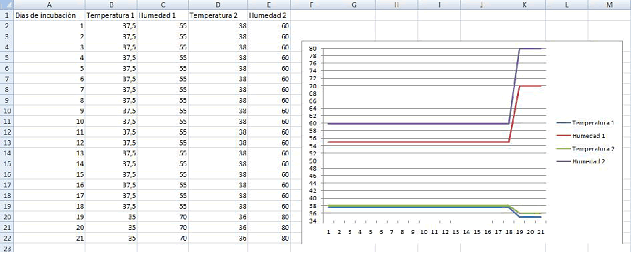
1. Temperature and humidity before and after starting the incubator and during the incubation process to compare data between each other


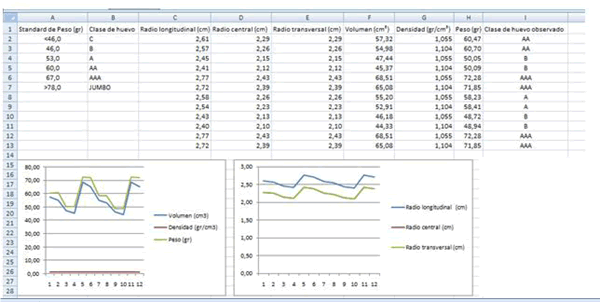
2. Extrapolación of individual eggs weights from their axes:
For that, on the photographs obtained during the process of investigation, a measurement of the length and the width and thus, taking into account that the average densities of the eggs is between 1.055 - 1.104 gr/cm3, various measures proposed below can be established.
3. Egg average weight extrapolation:
It is enough with relating the volume of the egg, as established in Activity 4, with the average density of the eggs.

4. Number of unfertilized eggs:
Observing the images through the ovoscope in the days 7, 14 and 18 of embryonic development, we can establish whether the air chamber in the interior of the egg is increasing or not. This will mean if the egg is still in its development process or otherwise it is a unfertilized egg, i.e., where the embryo stopped being developed. If the egg can be weigh then, you could see that its weight can be diminished up to a 12%.

5. Unfertilized eggs
6. Number of hatched eggs
7. % hatched eggs
8. Number of first-class chicks
Once the incubation process has concluded, we establish a relationship between the number of incubated eggs and the hatched eggs and the ones that have not developed because the conditions of incubation were not the most appropriate for them. From there, two control measures about the embryo development can be inferred:
On one hand, the fertility percentage is obtained which related the number of fertilized eggs
On the other hand there is the hatchability percentage that relates the number of chicks born against the number of fertilized eggs.
9. Other important information:
Provide, in relation to the colour of the incubated egg shell, if the number of hatchings shows variability or not.
A table with all the data collected every day should be created. This could have the following form:
|
Monday |
Tuesday |
Wednesday |
Thursday |
Friday |
Saturday |
Sunday |
|
|
|
Day 1 |
Day 2 |
Day 3 |
Day 4 |
Day 5 |
|
|
|
T. 37.5-38 ºC H 55-60% |
T. 37.5-38 ºC H 55-60% |
T. 37.5-38 ºC H 55-60% Start turning |
T. 37.5-38 ºC H 55-60% turning
|
T. 37.5-38 ºC H 55-60% turning |
|
Day 6 |
Day 7 |
Day 8 |
Day 9 |
Day 10 |
Day 11 |
Day 12 |
|
T. 37.5-38 ºC H 55-60% turning |
T. 37.5-38 ºC H 55-60% turning |
T. 37.5-38 ºC H 55-60% turning |
T. 37.5-38 ºC H 55-60% turning
|
T. 37.5-38 ºC H 55-60% turning |
T. 37.5-38 ºC H 55-60% turning |
T. 37.5-38 ºC H 55-60% turning |
|
Day 13 |
Day 14 |
Day 15 |
Day 16 |
Day 17 |
Day 18 |
Day 19 |
|
T. 37.5-38 ºC H 55-60% turning |
T. 37.5-38 ºC H 55-60% turning |
T. 37.5-38 ºC H 55-60% turning |
T. 37.5-38 ºC H 55-60% turning |
T. 37.5-38 ºC H 55-60% turning |
T. 35-36 H 55-60% End of turning. Increment the entry of O2 |
T. 35-36
H 70-80%
|
|
Day 20 |
Day 21 |
|
|
|
|
|
|
T. 35-36 H 70-80%
|
T. 35-36 H 70-80%
|
|
|
|
|
|